Inputs
Use the Inputs tab to define the decision and uncertainty areas, their variables and alternative cases, along with the key results to be tracked and any goals you have for them.
Step 1: Define Decision Areas
Decision areas represent the incremental choices you control in your analysis. These are the strategic options you are trying to decide between. Each area is considered independent of the others, and the analysis will test all combinations of decisions.
Setting Up Decision Areas:
- Type the area name e.g., Expansion, Budget Level
- Click Add button on the Decision Area header
Note that if no label is defined then a default label of "Decision X" will be used where X is the number of the decision areas defined to that point.
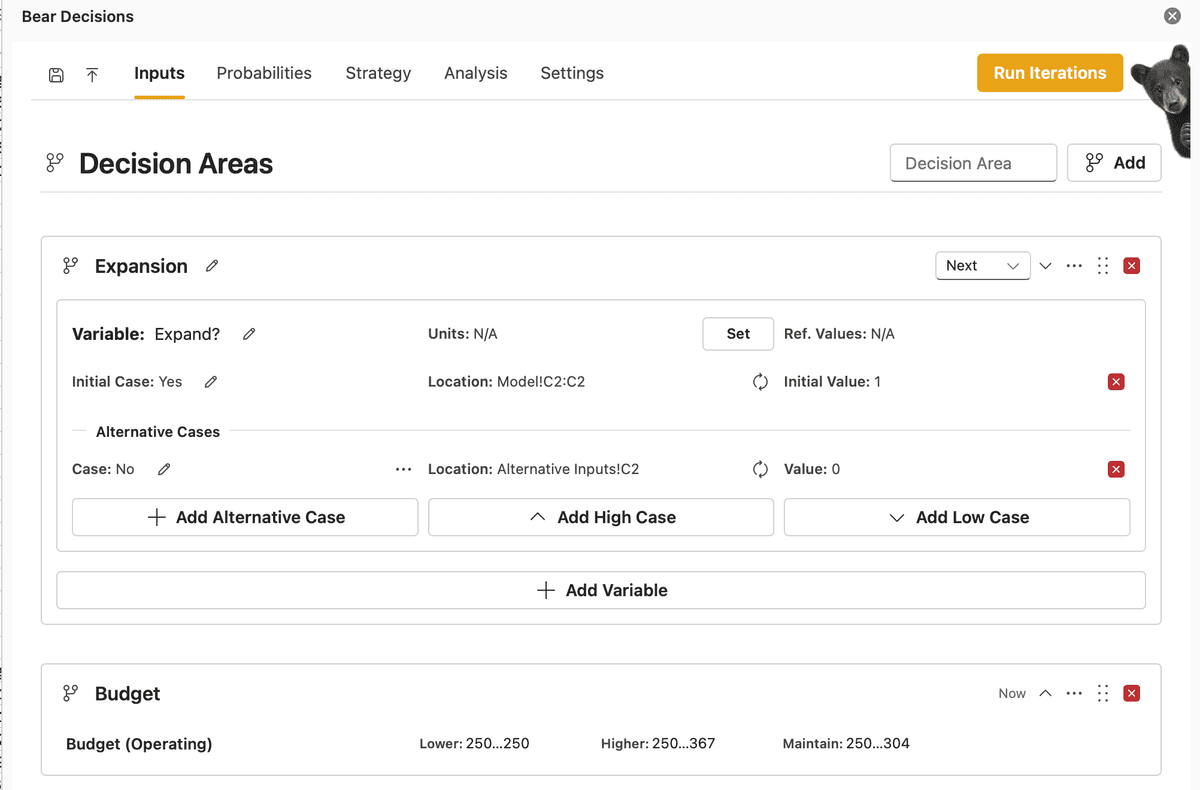
Note that only if you have the strategy mode enabled will there be the timing dropdown in the top right.
Step 2: Define Uncertainty Areas
Uncertainty areas represent external factors that could impact your results but are outside your direct control. You have already quantified a case within your existing Excel model. Adding this area enables you to input alternative deterministic outcomes for each area.
Each case within an area has its own likelihood of occurrence, and by default each uncertainty is treated as separate from the others when you combine scenarios. The analysis tests all combinations of uncertainty cases; on the Probabilities tab (later) you can optionally tie some likelihoods to specific decisions or other uncertainties.
Setting Up Uncertainty Areas:
- Type the area name e.g., Market Conditions, Escalation
- Click Add button on the Uncertainty Area header
Note that if no label is defined then a default label of "Uncertainty X" will be used where X is the number of the uncertainty areas defined to that point.
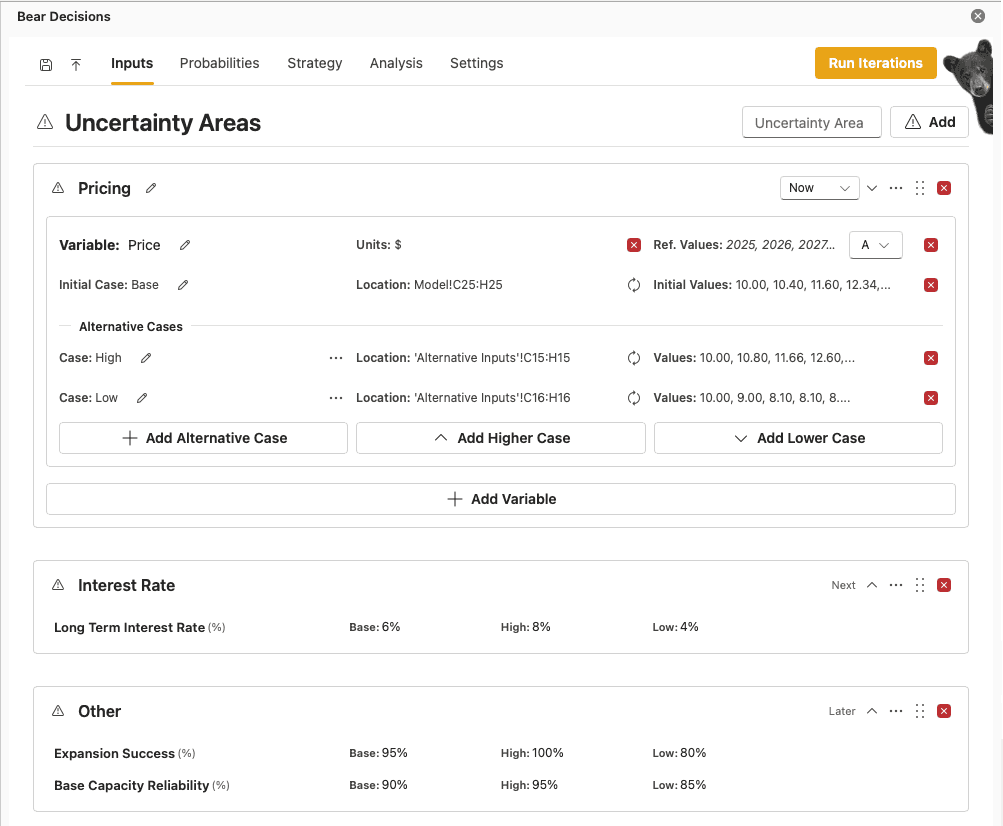
Note that only if you have the strategy mode enabled will there be the timing dropdown in the top right.
You must define at least one area of decision or uncertainty to run an analysis.
If you define an area as an uncertainty area incorrectly, then you can change it to a decision area by clicking on the "..." icon in the top right corner of the area and selecting "Change to Decision Area" (and vice versa).
Step 3: Add Variables to Areas
Once you have defined your decision and/or uncertainty areas, you need to add variables that specify where in your Excel model the associated inputs are located.
Adding Variables:
- In Excel, highlight the cells that represent the area (decision or uncertainty)
- Press Add Variable in Bear Decisions
- Name the variable appropriately (e.g., Capital Spend, Budget Level, Market Growth) if it was not already included in the highlighted cells.
- Name the case appropriately (e.g., Current, Optimistic, Pessimistic) if it was not already included in the highlighted cells.
- Set reference values and units if applicable by highlighting the cells containing the values then pressing "Set" appropriately.
A periodicity will automatically be applied to the whole variable based on the reference values, though you may choose to change this if you wish.
Notes:
- When adding the initial case, you may choose to include just the values for the variables, or alternatively also highlight the label for the variable and the case name if they are in a continuously connected cell range.
- Only if the case label is included within the highlighted cells will the case names be automatically updated when you calculate or select a specific instance.
- On first definition of a unit or reference value, this will be saved as the default for all subsequent variables of the same length.
- Defaults can be overridden by deleting the default and setting the values again as an explicit definition. Defaults themselves can be adjusted on resetting a set of inputs via the notification toast action or through the Settings menu.
Multiple Variables per Area
A single area can contain multiple variables. For example:
- Marketing Strategy Decision Area: Advertising budget allocation, Channel selection, Campaign duration
- Escalation Uncertainty Area: Steel price escalation rate, Energy cost escalation rate, CO2 tax escalation rate
Each variable has its own inputs, but they are grouped together because they represent related aspects of the same decision or uncertainty theme.
⚠️ Important Variable Requirement Guidelines:
- Each variable should represent a direct input that drives your model
- You may need to add extra input cells within your model if your idealized current inputs have calculations incorporated into them and adjust the formulas to handle the switching logic
Step 4: Configure Alternative Cases for each Variable
Alternative cases define the different values for each variable within a decision or uncertainty area. These represent the specific options you want to test. You can choose to add pre-defined alternative values, or alternatively define how you want to factor your initial values to achieve the same outcome.
Adding Alternative Cases
- For each Variable within an Area, highlight the cells containing alternative values
- Press Add Alternative Values for the corresponding variable
- Name the case appropriately (e.g., Current, Optimistic, Pessimistic) if it was not already included in the highlighted cells.
- Repeat for each case you want to test
Note: When adding the alternative case, you may choose to include just the values, or alternatively also highlight the label for the case name if they are in a continuously connected cell range. You may also import multiple alternative cases at once by simply highlighting the entire case range.
and / or...
Factoring the Initial Values to create Alternative Cases
- For each Variable within an Area, simply click on either Add High Case or Add Low Case. This will create a new case for the variable with defaults.
- You can choose the edit the default settings by clicking on the gear icon. This will open a dialog box where you can adjust the settings for how you want to factor the initial values
- You can choose how to apply the delta to the initial values - either as a scalar multiplier, or as an addition/subtraction of absolute values
- You can also choose to factor the values immediately, or over a timeframe if it is an array, along with a delay on divergence to cover the instance where you may have some actuals earlier in the timeline
- Once you have adjusted the settings, click Save to update the case's values
- Repeat for each case you want to test (up to 4 high and 4 low cases)
⚠️ Critical Case Completeness Rule:
All cases must have inputs for every variable within an area, or that case will be skipped as ill-defined. If you have 3 variables in an uncertainty area, each case must provide values for all 3 variables.
If at a late date you want to make your Alternative Case your initial case, you can do so by clicking on the ... icon to the right of the case name and selecting "Make Initial Case".
Step 5: Set Up Tracked Results
Tracked results are the key outputs you want to monitor across all scenarios. These become the key metrics you will analyze in your dashboards.
Adding Tracked Results:
- In Excel, highlight cells containing the results you want to track
- Press Add Tracked Results button on the Tracked Results header (or just Add if the screen is narrow)
- Name the result appropriately (e.g., NPV, Cash Flow, EBITDA) if it was not already included in the highlighted cells.
- Set reference values and units if applicable by highlighting the cells containing the values then pressing Set appropriately. Where a default has been set for the variable length, this will be used automatically.
- Adjust the Mode if you do not want to the default of maximizing the outcome for any optimizations later in the process along with selecting which reference goal to constrast it against if applicable (see below). Options are: Maximze, Minimize, Satisfied or Constrained.
Satisified is set as achieved so long as means that it exceeeds the reference goal, while Constrained means that it is less than the reference goal. - Repeat for each key metric
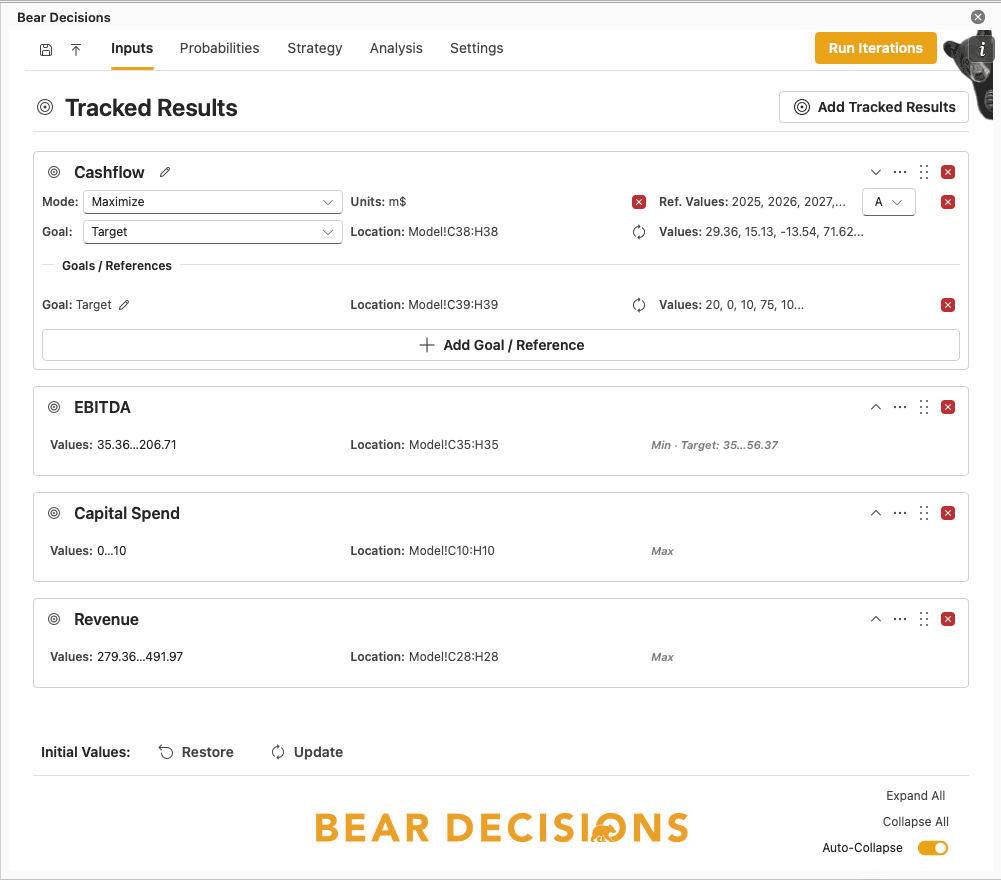
For tracked results, you can also define goals or reference values for comparison:
Adding Goals / References:
- In Excel, highlight cells containing your goal/reference values
- Press "Add Goal / Reference" for the corresponding tracked result
- Name the goal/reference appropriately (e.g., "Target Cashflow", "Reference Cash Flow", "Reference EBITDA") if it was not already included in the highlighted cells.
- Repeat for each additional goal/reference you have for the tracked result
Note: You can also add just a single value for a goal or reference — it will repeat for all matching values of an array, if applicable.
Next Steps
When your Inputs definition is ready, go to Calculation for details about generating results via Run Iterations, how the scenarios are built, configuring macros during the loop, and what comes next after you have numbers. Then continue with Strategies & Timings and Probabilities & Signals.